Home › Cybersecurity Tools › Wireshark: Complete Guide to Features, Installation, Packet Analysis & Best Practices
Cybersecurity ToolsWireshark: Complete Guide to Features, Installation, Packet Analysis & Best Practices
By Himanshu Borikar • 2026-07-23 • 16 min read
Last updated: July 2026
Quick Summary: Wireshark is the industry-standard free and open-source network protocol analyzer. It captures live network traffic in real time and decodes raw packets down to individual protocol fields across Ethernet, IP, TCP, UDP, DNS, HTTP, and TLS for deep network troubleshooting, digital forensics, and security auditing.
Introduction
Ask any network engineer or SOC analyst which tool they'd want if they could only keep one, and Wireshark comes up almost every time. It's the tool that shows you what's actually moving across the wire - not a summary, not a log line, but the raw packets themselves, broken down layer by layer.
Wireshark is a free, open-source network protocol analyzer that captures and inspects traffic in real time. It's been the de facto standard for packet analysis for over two decades, used for everything from diagnosing a flaky application connection to reconstructing what happened during a security incident.
Security researchers rely on it to understand protocol behavior. Incident responders use it to reconstruct attacker activity. Digital forensics analysts use it to pull evidence out of captured traffic. Network engineers use it to chase down latency and misconfiguration issues that logs alone can't explain. And for beginners, Wireshark is often the single best way to actually see how networking concepts like the OSI model and TCP vs UDP play out in real traffic, rather than just reading about them.
This guide covers what Wireshark is, how to install it safely, how to start capturing and analyzing traffic, and where it fits next to other tools like tcpdump and Zeek.
Quick Overview Table
| Attribute | Details |
|---|---|
| Tool Name | Wireshark |
| Developer | Gerald Combs and the Wireshark Foundation |
| License | GNU General Public License v2 (or later) |
| Category | Network protocol analyzer / packet sniffer |
| Latest Stable Version | 4.6.7 (July 2026) |
| First Release | 1998 (originally released as Ethereal) |
| Supported Operating Systems | Windows, Linux, macOS, and most Unix variants |
| Interface | Graphical (GUI) with a command-line companion, TShark |
| Official Website | wireshark.org |
| Official Documentation | wireshark.org/docs |
| GitLab Repository | gitlab.com/wireshark/wireshark |
| Pricing | Free and open source |
| Free Version Availability | Yes - full feature set, no paid tier |
| Best For | Packet capture, protocol analysis, network troubleshooting, forensic investigation |
What is Wireshark?
Wireshark is a free, open-source network protocol analyzer that captures live network traffic and displays it in human-readable detail, packet by packet.
The project began in 1998 under the name Ethereal, created by Gerald Combs. It was renamed Wireshark in 2006 after a trademark dispute, and development has continued ever since under an active open-source community, now stewarded by the nonprofit Wireshark Foundation. It's licensed under the GNU General Public License (GPL), meaning it's free to use, modify, and distribute.
At its core, Wireshark works by putting a network interface into promiscuous mode (where supported) and capturing packets as they pass through, then decoding them according to the protocols involved - Ethernet, IP, TCP, DNS, HTTP, TLS, and thousands more. What you get is a structured, layer-by-layer breakdown of exactly what two systems said to each other.
Wireshark shows up across nearly every industry that runs a network: finance, healthcare, telecom, government, and software development. It's used in SOC environments for traffic investigation, in QA and development teams for debugging protocol implementations, and in classrooms for teaching how networking actually works under the hood.
How Wireshark Works
Wireshark follows a systematic capture and analysis pipeline:
Network Interface Selection (Promiscuous Mode)
    |
Live Packet Capture (Npcap / libpcap / BPF)
    |
Capture Filtering (BPF Syntax)
    |
Protocol Dissection & Layer Decoding
    |
Display Filtering (Wireshark Syntax)
    |
Stream Reconstruction & Forensic Inspection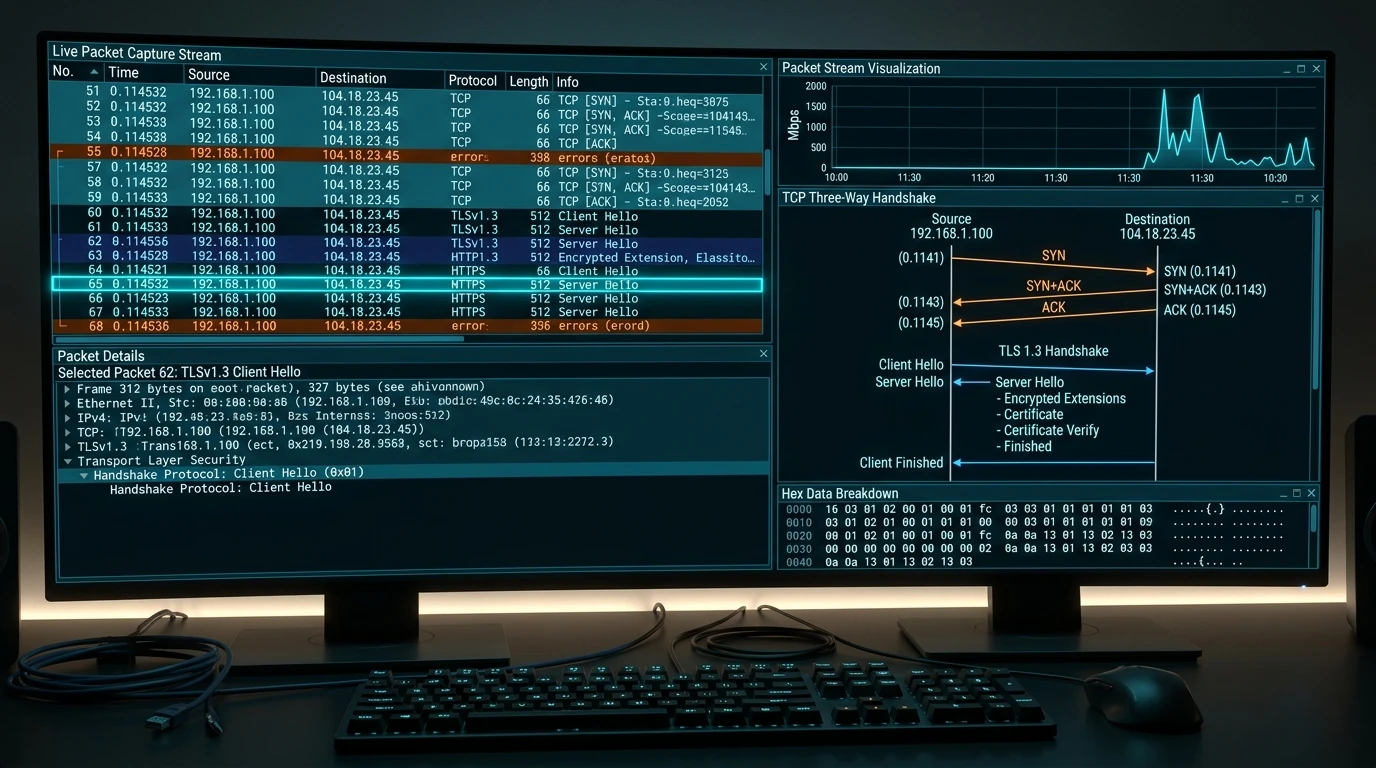
Key Features
| Feature | What It Does |
|---|---|
| Live Packet Capture | Captures traffic in real time from a selected network interface |
| Deep Packet Inspection | Decodes packet contents down to individual protocol fields |
| Protocol Analysis | Supports decoding for thousands of protocols out of the box |
| Network Troubleshooting | Highlights retransmissions, errors, and latency issues |
| Capture Filters | Limit what's captured at the point of collection (BPF syntax) |
| Display Filters | Narrow down already-captured traffic for analysis |
| Stream Following | Reassembles a full TCP/UDP conversation into readable form |
| VoIP Analysis | Reconstructs and plays back VoIP call traffic for review |
| Wireless Packet Analysis | Captures and inspects 802.11 wireless traffic |
| IPv4 & IPv6 Support | Fully decodes both IP versions |
| Exporting Captures | Saves captures in .pcap, .pcapng, and other formats |
| Statistics Dashboard | Visual summaries like protocol hierarchy and I/O graphs |
| Cross-platform Support | Native builds for Windows, macOS, and Linux |
| Extensibility | Supports custom dissectors and Lua scripting |
Two features deserve special mention because beginners often confuse them. Capture filters decide what gets recorded in the first place - set before capture starts, using Berkeley Packet Filter (BPF) syntax. Display filters operate after the fact, letting you narrow down what you're looking at within an already-captured file, using Wireshark's own filter syntax (like http.request or tcp.port == 443). Getting comfortable with both is a big part of using Wireshark efficiently.
Download & Installation Guide
Always download Wireshark from the official Wireshark download page or its official GitLab repository. Third-party download sites frequently bundle outdated or modified installers.
| Platform | Installation Method |
|---|---|
| Windows | Download the installer from wireshark.org; it bundles Npcap, required for live capture |
| Kali Linux | Pre-installed; update with sudo apt update && sudo apt install wireshark |
| Ubuntu | sudo apt update && sudo apt install wireshark |
| Debian | sudo apt update && sudo apt install wireshark |
| Fedora | sudo dnf install wireshark |
| Arch Linux | sudo pacman -S wireshark-qt |
| macOS | Download the .dmg installer from wireshark.org, or brew install --cask wireshark |
Installing Npcap on Windows: Npcap is the packet-capture driver Wireshark relies on for live traffic capture. It's included in the official Windows installer, but if capture doesn't work, reinstall it separately from npcap.com and make sure "Support raw 802.11 traffic" is enabled if you need wireless capture.
Verifying installation: Run wireshark --version (or tshark --version for the CLI companion) in a terminal to confirm the install and check the version number.
Common installation issues:
- No interfaces show up on Linux - your user likely isn't in the
wiresharkgroup; add it withsudo usermod -aG wireshark $USERand log out and back in. - Permission denied capturing on Linux - capture requires elevated privileges or the
CAP_NET_RAW/CAP_NET_ADMINcapabilities set ondumpcap. - Capture fails on Windows - usually an Npcap installation or driver conflict; reinstall Npcap.
Updating Wireshark: Use your platform's package manager (apt, dnf, pacman, or brew) for Linux/macOS installs, or download the latest installer from the official site for Windows. Keeping Wireshark current matters - releases regularly patch dissector vulnerabilities.
Getting Started
The steps below assume you're capturing traffic on a network and systems you own or are explicitly authorized to monitor.
- Launch Wireshark - opens to a list of available network interfaces.
- Select the correct interface - choose the adapter carrying the traffic you want to observe (e.g., your Ethernet or Wi-Fi adapter).
- Start the capture - double-click the interface, or click the shark-fin icon.
- Stop the capture - click the red square icon when you have what you need.
- Save the capture file -
File > Save As, typically as.pcapng. - Open an existing capture -
File > Opento review a previously saved file. - Read packet information - each row is a packet; the panes below show layer-by-layer protocol detail and raw bytes.
Useful starter display filters:
| Traffic Type | Filter |
|---|---|
| DNS queries | dns |
| HTTP traffic | http |
| HTTPS/TLS traffic | tls |
| All TCP traffic | tcp |
| All UDP traffic | udp |
| Traffic to/from an IP | ip.addr == 192.168.1.10 |
Real-World Use Cases
- SOC Operations - investigating flagged traffic and validating alerts
- Incident Response - reconstructing attacker network activity during a breach
- Malware Analysis - observing command-and-control or exfiltration traffic in a sandboxed environment
- Network Troubleshooting - diagnosing latency, drops, and misconfigurations
- Security Monitoring - spotting anomalous protocol behavior
- Digital Forensics - extracting evidence from captured traffic for forensic investigations
- Performance Analysis - identifying retransmissions and bottlenecks
- Cloud Networking - validating traffic flows in cloud-hosted environments
- Wireless Network Analysis - inspecting 802.11 traffic and Wi-Fi issues
- Cybersecurity Education - teaching protocol behavior and packet structure hands-on
Advantages
- Free and open source under the GPL, with no cost for any feature
- Supports thousands of protocols, from common ones to obscure industrial and IoT protocols
- Powerful, precise filtering with both capture and display filter syntax
- Cross-platform, with consistent behavior across Windows, macOS, and Linux
- Backed by a large, active community and extensive official documentation
- Widely recognized as the industry standard for packet analysis
Limitations
- Requires real networking knowledge to interpret results meaningfully
- Cannot decrypt encrypted traffic (like TLS) without the appropriate keys
- Large or long-running captures can consume significant disk space
- Has a real learning curve, especially around filter syntax and protocol internals
- Passive analysis only - it's not a vulnerability scanner or an active testing tool
Best Practices
- Capture only authorized traffic - never capture on networks or systems you don't have explicit permission to monitor
- Protect sensitive captures -
.pcapfiles can contain credentials, personal data, or proprietary information; store and share them securely - Use display filters effectively - narrow captures down instead of scrolling through thousands of packets
- Keep Wireshark updated - dissector vulnerabilities are patched regularly in new releases
- Work in isolated lab environments when possible - especially for malware traffic analysis
- Document findings clearly - annotate and export relevant packets when building a report
Pricing
Is Wireshark free? Yes. Wireshark is completely free and open source under the GPL-2.0-or-later license. There's no paid tier, no feature gating, and no license cost for commercial or enterprise use.
Enterprise adoption is common precisely because of this - organizations can deploy Wireshark widely without licensing overhead. There's no official paid support channel from the Wireshark Foundation itself; support comes through community channels, mailing lists, the official documentation, and third-party training such as the SharkFest conference series.
[!NOTE] Note
Pricing and licensing information is accurate at the time of writing. Refer to the official Wireshark website for the latest information.
Wireshark vs Alternatives
| Tool | Strengths | Best For |
|---|---|---|
| Wireshark | Deep protocol decoding, GUI-driven analysis, powerful filtering | Detailed, interactive packet analysis |
| tcpdump | Lightweight, command-line, available almost everywhere | Quick captures on servers without a GUI |
| TShark | Wireshark's command-line sibling, same dissectors, scriptable | Automated or headless packet analysis |
| Zeek | Generates high-level network security logs rather than raw packets | Large-scale network security monitoring |
| Microsoft Network Monitor (historical) | Native Windows capture tool, now discontinued in favor of Wireshark/Npcap-based tools | Legacy Windows environments only |
When Wireshark is the better choice: when you need to visually dig into packet contents, follow full conversations, or teach/learn protocol behavior interactively. When command-line tools are preferable: on headless servers, for scripted/automated captures, or when you need something lightweight - tcpdump or TShark fit better there, and the resulting captures can still be opened in Wireshark later for deeper analysis.
Frequently Asked Questions
What is Wireshark?
Wireshark is a free, open-source network protocol analyzer used to capture and inspect network traffic in detail.
What is Wireshark used for?
It's used for network troubleshooting, security monitoring, incident response, digital forensics, and protocol education.
Is Wireshark free?
Yes. Wireshark is free under the GPL, with no paid version or licensing fee required.
Is Wireshark legal?
Wireshark itself is legal software. Capturing traffic on a network you don't own or have permission to monitor is not - authorization is essential.
Can beginners learn Wireshark?
Yes. The interface is approachable for basic captures, though mastering filters and protocol details takes practice over time.
Does Wireshark capture passwords?
It can, if credentials are sent in plaintext over an unencrypted protocol. This is one reason captured traffic must be handled and stored securely.
Can Wireshark decrypt HTTPS traffic?
Only if you have the appropriate decryption keys or session key logs, such as those exported from a browser configured for TLS key logging. It cannot decrypt TLS traffic without them.
Does Wireshark work on Windows?
Yes. Wireshark has an official Windows installer that includes the Npcap driver needed for live capture.
What's the difference between capture filters and display filters?
Capture filters limit what's recorded during capture using BPF syntax; display filters narrow down what you view afterward using Wireshark's own filter syntax.
Is Wireshark safe?
Yes, the software itself is safe when downloaded from the official source. Risk comes from what you do with it - capturing without authorization, or mishandling sensitive capture files.
What is the difference between Wireshark and tcpdump?
Wireshark provides a graphical interface with deep, interactive protocol decoding, while tcpdump is a lightweight command-line tool best suited for quick captures on servers.
Conclusion
Wireshark has held its place as the industry-standard packet analyzer for a reason: it turns invisible network traffic into something you can actually read, filter, and understand. Whether you're troubleshooting a flaky connection, investigating a security incident, or just trying to understand how common network ports and protocols behave in practice, Wireshark gives you a ground-truth view that logs and dashboards can't fully replace.
If you're new to packet analysis, a good next step is pairing Wireshark practice with foundational reading on networking for cybersecurity and TCP vs UDP, then working alongside complementary tools like Nmap for discovery and Zeek for large-scale monitoring - building toward a well-rounded, defensively focused toolkit.
Version numbers, licensing, and pricing details in this article are accurate at the time of writing. Always refer to the official Wireshark website for the latest information.
Related Technical Reviews & Cybersecurity Tools
- 📡 Nmap: Complete Guide to Features, Installation, Use Cases & Best Practices - Network discovery, port scanning, OS fingerprinting, and Lua NSE scripting.
- 🛡️ LLM Security in 2026: OWASP Top 10 for AI Applications - Protect production AI systems against prompt injection, data leaks, and insecure output handling.
- 🤖 MCP Security Unlocked: Defending Model Context Protocol & AI Agents - Complete engineering guide to Model Context Protocol security and tool execution safety.
- 🔒 OAuth 2.0 Unlocked: The Developer's Field Guide to Secure Authorization - PKCE, OAuth 2.1, security failure modes, and secure React token storage.